globeimage documentation
The globeimage function creates a "Blue Marble" 3D globe image.
Back to Climate Data Tools Contents.
Contents
Syntax
globeimage
globeimage('gray')
globeimage(I)
globeimage('radius',GlobeRadius)
h = globeimage(...)
Description
globeimage plots a Blue Marble Earth image on a 3D globe.
globeimage('gray') plots the earth image in grayscale.
globeimage(I) stretches the image I such that its top and bottom extend to the poles and its edges meet at the International Date Line.
globeimage(...,'radius',GlobeRadius) specifies the radius of the globe. The default GlobeRadius is 6371, the standard radius of the Earth in kilometers.
h = globeimage(...) returns the handle h of the plotted object.
Example 1
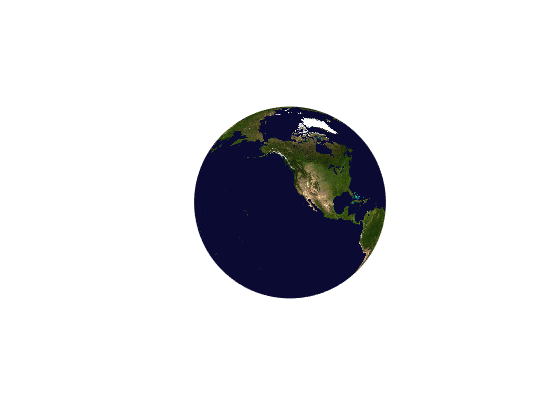
The simplest case, just type globeimage:
globeimage
Example 2
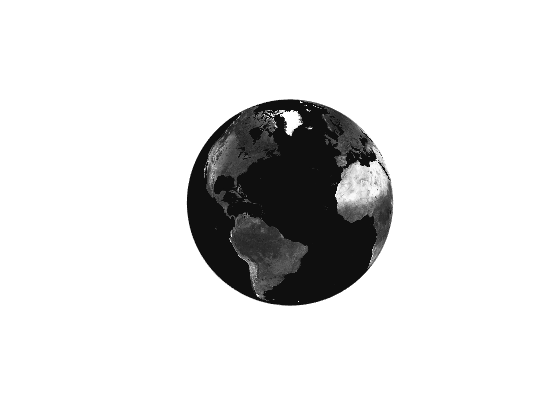
Make a grayscale globeimage and set the viewing angle:
figure
globeimage('gray')
view(45,20)
Example 3: Your own image
If you're working with a planet other than Earth and you want to use an image of that instead, this option is for you. But it really can be any image.
Below, load the CDT logo and plot it on a globe. Add political boundaries using globeborders for context:
I = imread('cdt.jpg');

figure
globeimage(I)
axis tight
globeborders('color',rgb('orange'))
view(10,30)

Author Info
This function is part of the Climate Data Toolbox for Matlab. The function and supporting documentation were written by Chad A. Greene of the University of Texas at Austin.