borders documentation
borders plots National or US state boundaries without Matlab's Mapping Toolbox. If you want to plot borders on a map generated by Matlab's Mapping Toolbox, use bordersm instead.
Data are compiled from 2013 US Census Bureau 500k data and a thematicmapping.org TM World Borders 0.3 dataset.
Back to Climate Data Tools Contents.
Contents
Syntax
borders
borders(place)
borders(...,LineProperty,LineValue)
borders(...,PatchProperty,PatchValue)
borders(...,'center',centerLon)
h = borders(...)
[lat,lon] = borders(place)
Description
borders plots national borders.
borders(place) plots the borders of a place, which can be any country or US state. place may also be 'countries' to plot all national borders, 'states' to plot all US state borders, or 'Continental US' to plot only the continental United States (sorry Guam). Note: to plot the nation of Georgia, use 'Georgia'. To plot the US state of Georgia, specify 'Georgia.' with a period.
borders(...,LineProperty,LineValue) specifies linestyle or markerstyle.
borders(...,PatchProperty,PatchValue) outlines states or nations as patch objects if any property begins with 'face', (e.g., 'facecolor','red'). Note that plotting all countries as patches can be a bit slow.
borders(...,'center',centerLon) specifies a central longitude. Default is 0.
h = borders(...) returns a handle h of plotted object(s).
[lat,lon] = borders(place) does not plot any borders, but returns arrays of their geographic coordinates.
Example 1: Very simple
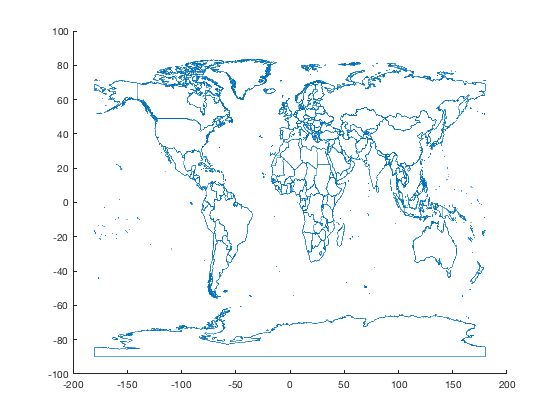
To plot all national borders, just type borders:
borders
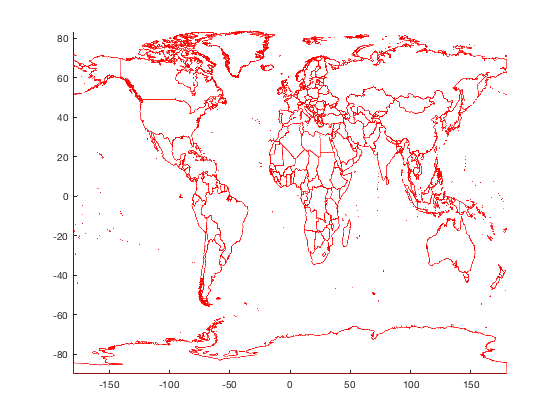
Or specify line properties like this:
borders('countries','r')
axis tight
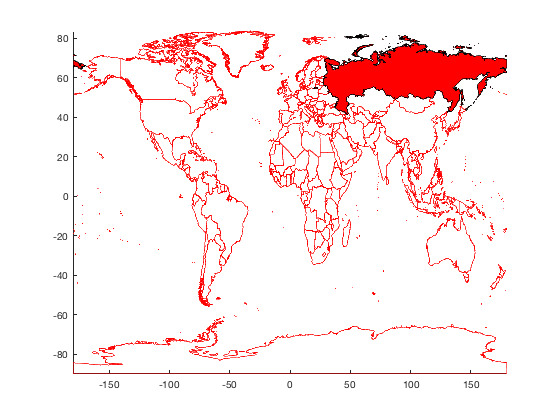
Example 2: Red Russia, red Russia
Add Russia to the map as a big red patch:
borders('russia','facecolor','red')
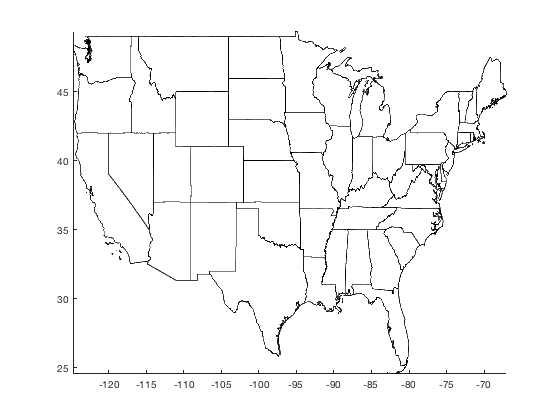
Example 3: Continental US
Open a new figure and plot the continental United States oulined in black:
figure
borders('continental us','k')
axis tight
Example 4: Fancy formatting
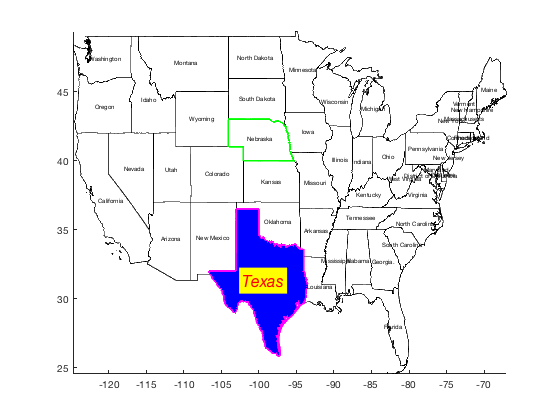
Let's turn Texas blue (that'll be the day), give it a thick magenta outline, and give Nebraska a thick green outline. The labelborders function works just like the borders function.
borders('texas','facecolor','blue','edgecolor','m','linewidth',2)
borders('nebraska','g','linewidth',2)
labelborders('continental us','fontsize',6);
labelborders('Texas','color','r','backgroundcolor','y',...
    'fontangle','italic','fontsize',16)
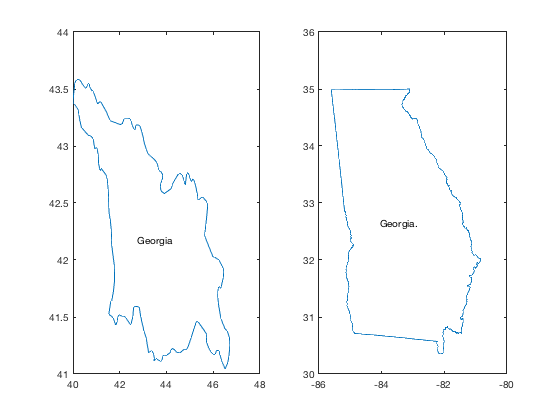
Example 5: Georgia vs. Georgia.
There are two Georgias. To distinguish between them, I've placed a period at the end of the US state called Georgia. Let us compare:
figure
subplot(121)
borders 'georgia'
labelborders 'Georgia'
subplot(122)
borders 'georgia.'
labelborders 'Georgia.'
Example 6: Data only
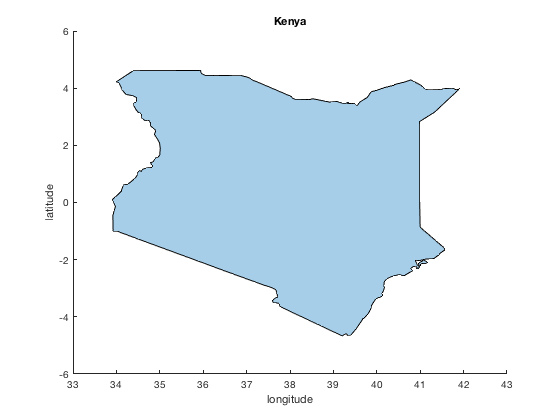
Just want the outline of a country or state without plotting it? Using borders with two outputs returns lat, lon arrays without plotting.
[lat,lon] = borders('kenya');

With geo coordinate data in hand, you can plot it however you wish. The new polyshape function is one way to do it:
pgon = polyshape(lon,lat,'simplify',false);

figure
plot(pgon)
xlabel longitude
ylabel latitude
title Kenya
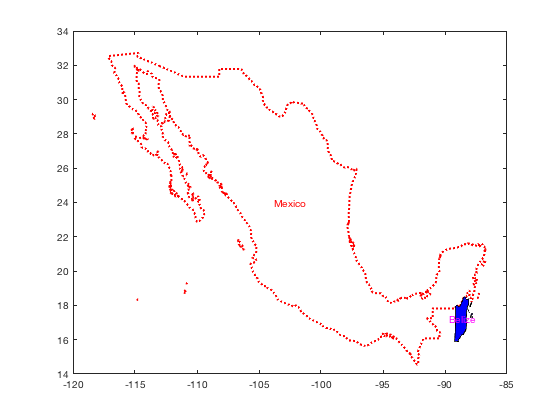
Example 8: More formatting
figure
borders('mexico','r:','linewidth',2)
hold on
borders('belize','facecolor','b','linestyle','-','linewidth',1)
labelborders('Mexico','color','r')
labelborders('Belize','color','m')
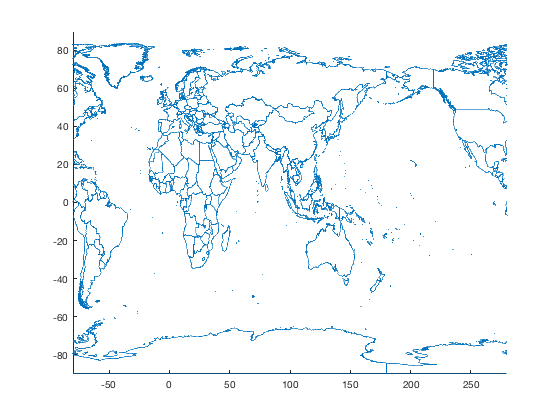
Example 9: Specify central longitude
Don't want the prime meridian in the middle of the map? Specify your own favorite central longitude like this:
figure
borders('countries','center',100)
Author Info
The borders and labelborders functions were written by Chad A. Greene of the University of Texas at Austin's Institute for Geophysics (UTIG), April 2015. This function is part of the Climate Data Toolbox for Matlab.