stipplem documentation
stipplem creates a hatch filling or stippling in map coordinates. This function is designed primarily to show regions of statistical significance in spatial maps.
This function requires Matlab's Mapping Toolbox. For a versions that do not require the mapping toolbox, see stipple or globestipple.
Back to Climate Data Tools Contents.
Contents
Syntax
stipplem(lat,lon,mask)
stipplem(...,MarkerProperty,MarkerValue,...)
stipplem(...,'density',DensityValue)
stipplem(...,'resize',false)
h = stipplem(...)
Description
stipplem(lat,lon,mask) plots black dots in x,y locations wherever a mask contains true values. Dimensions of x, y, and mask must all match.
stipplem(...,MarkerProperty,MarkerValue,...) specifies any marker properties that are accepted by the plot function (e.g., 'color', 'marker', 'markersize', etc).
stipplem(...,'density',DensityValue) specifies density of stippling markers. Default density is 100, but if your plot is too crowded you may specify a lower density value (and/or adjust the markersize).
stipplem(...,'resize',false) overrides the 'density' option and plots stippling at the exact resolution of the input grid. By default, the grids are resized because any grid larger than about 100x100 would produce so many stippling dots it would black out anything under them.
h = stipplem(...) returns a handle of the plotted stippling objects.
Examples
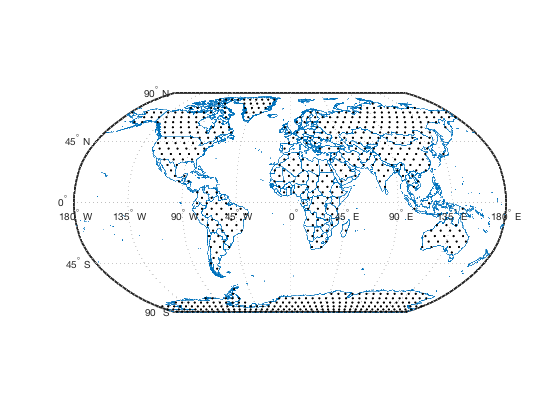
On a world map, fill in all the land areas with stippling. To determine land areas, make a grid with cdtgrid and determine the corresponding land grid cells with island.
[lat,lon] = cdtgrid(0.25);
land = island(lat,lon);
Now initialize a map with bordersm and put default stippling wherever there's land:
bordersm
stipplem(lat,lon,land)
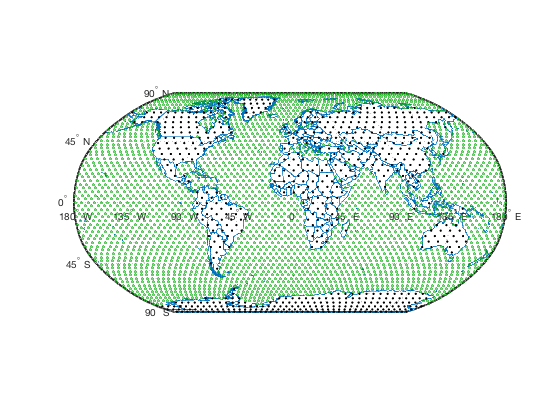
Now fill the ocean with a dense grid of tiny green triangle hatches:
stipplem(lat,lon,~land,'color',rgb('green'),...
   'marker','^','markersize',2,'density',150)
Author Info
This function and supporting documentation were written by Chad A. Greene, August 2018.